Operating Concept
Portfolio Fog
Portfolio reporting exists so leadership can see across dozens of initiatives at once. A reporting rule that compresses different operating conditions into one status can remove the distinctions leadership needs to act.
Definition
Portfolio Fog is the structural condition in which aggregated portfolio reporting smooths team-level operating states into summary status, hiding blockage, thrash, and overload from the leaders who steer by it.
A useful summary preserves the differences that call for action, such as a blocked dependency or a team beyond its capacity.
The recognition pattern
Portfolio Fog is recognizable from operating signals, not from the quality of the dashboard itself. Look for these fingerprints:
- Initiative status flips from green to red with no yellow warning phase.
- Quarterly reviews reveal problems teams knew about for months but never escalated.
- Leadership expresses surprise at delays that were visible to anyone close to the work.
- Teams quietly absorb unsustainable workloads to keep their status indicators clean.
- Rolled-up metrics show “on track” while individual teams are blocked, waiting, or thrashing.
Any one signal can have an innocent explanation. Together they mean the reporting layer is hiding more than it reveals.
How the mechanism works
Consider a reporting rule that compresses five different team conditions into one portfolio status. One team is blocked waiting for an architecture review. Another is thrashing because requirements keep changing. A third is underwater from attrition. A fourth sits idle behind a dependency. A fifth is moving fast. The aggregate reads “generally on track with some challenges.” Under this hypothetical rule, the fast team’s progress offsets the reported problems, and the need for help disappears from the summary.

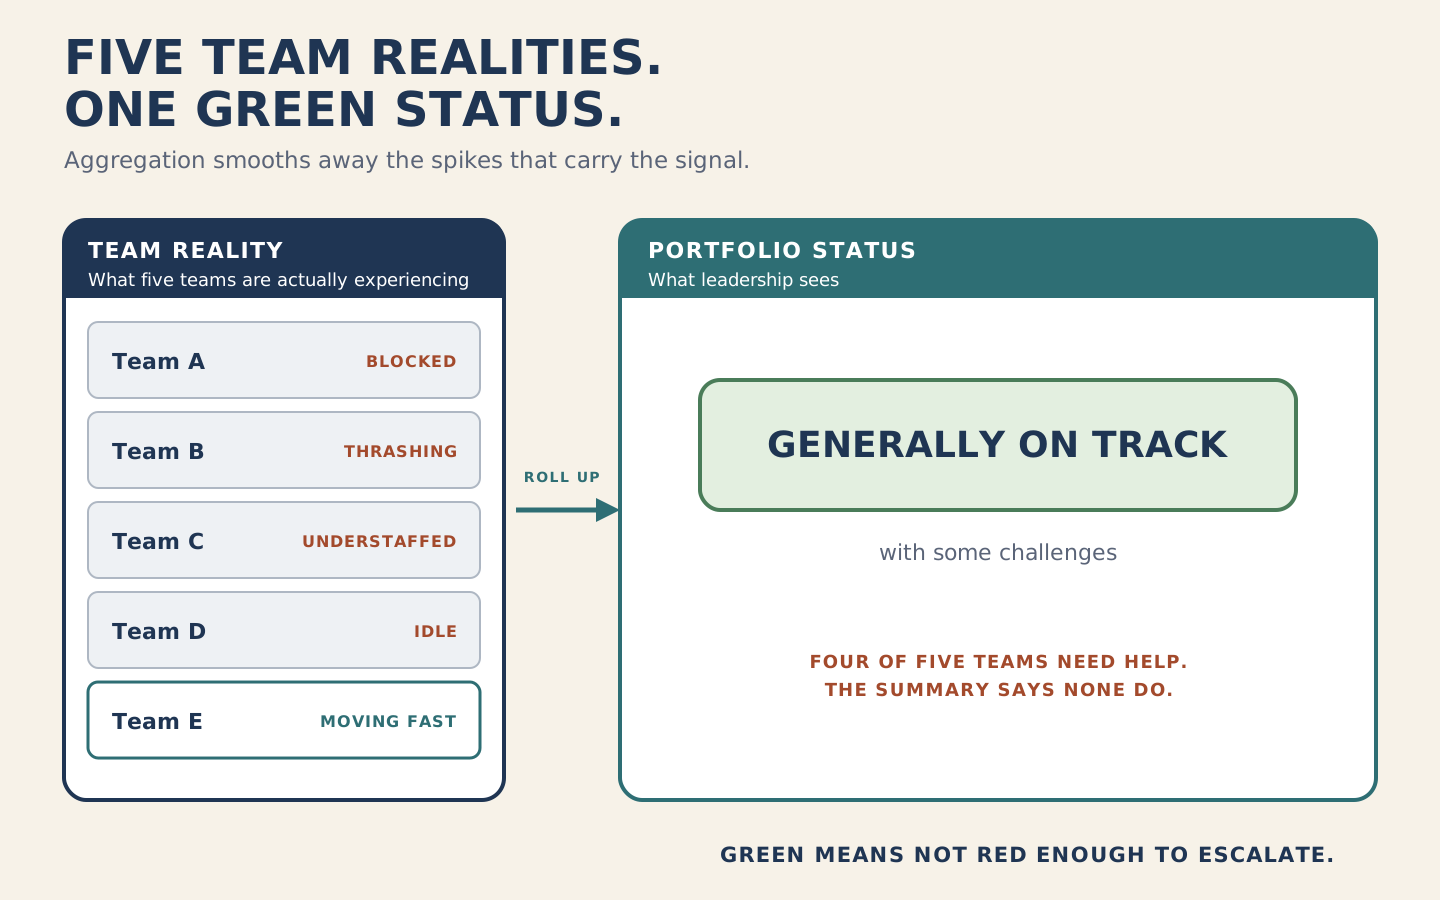
This is not a defect in any particular tool. You cannot show the detailed state of fifty teams in a one-hour executive review, so the organization creates abstractions: red, yellow, green, percent complete, milestones hit. The abstractions enable executive consumption. They also redefine what the words mean. Green does not mean flowing well. It means not red enough to escalate. Yellow rarely means a team needs help. It usually means “we’re handling it,” even when handling it means the team is burning out to keep the indicator clean.
The incentives then finish the job. When green is the expectation and red triggers scrutiny, teams learn to stay green regardless of ground truth. They absorb problems silently and optimize for dashboard optics instead of delivery health. The reporting system becomes a performance, not a signal. No dishonesty is required, only rational people responding to what the system rewards.
What it costs
Leadership makes decisions on false signals. The portfolio looks healthy, so resource allocation follows the healthy picture. By the time the aggregate turns red, the underlying problem has matured from manageable to crisis, and early intervention has become late firefighting.
The second cost compounds the first. Because problems surface late and abruptly, leadership concludes the teams failed to communicate, and adds more reporting. More reporting means more aggregation, which deepens the fog.
Boundaries and distinctions
Portfolio Fog is about visibility, not honesty. The mechanism operates on truthfully reported inputs. Smoothing destroys the signal before anyone decides to shade a status.
Capacity Denial is about overload existing. Portfolio Fog is about overload being invisible. The two reinforce each other: leadership that cannot see overload in aggregated reports keeps adding work.
Decision-rights ambiguity is about authority. Teams may also fail to escalate because nobody knows who can say yes. Portfolio Fog hides problems even when escalation paths are perfectly clear.
This concept covers delivery-status aggregation. A similar loss occurs when customer metrics combine unlike segments into an acceptable overall result.
Example
An illustration, by construction. A portfolio of five teams: one blocked, one thrashing, one understaffed, one idle behind a dependency, one moving fast. Four of the five need help, and two are stopped outright. The rollup shows “generally on track,” because this hypothetical reporting rule compresses their different conditions into one status. Nothing in the summary is false. Everything in the summary is misleading.
Applied Test: measure your visibility lag
Choose three recent initiatives that missed their target dates. For each, find dated evidence of when the team recognized the relevant problem and when a leader with authority to act received it. Record the gap between those dates, the evidence used, and any uncertainty. If dates are unavailable, record the gap as unknown rather than reconstructing a precise number from memory.
These cases show visibility lag in the selected missed initiatives. They do not establish a lower bound or a representative lag for the portfolio. Aggregation Hides the Truth uses the record to examine which decisions the reporting delay affected.
Sources and lineage
Portfolio Fog is an Applied End-to-End Flow concept developed by Curtis Hibbs and Joshua Barnes. Its framework treatment comes from Applied End-to-End Flow: Enterprise, in the Alignment Drift barrier, where it connects to Capacity Denial, Decision-Rights Fog, and the Overload and Opinion Drift arcs of the Vicious Cycle.
Curtis Hibbs and Joshua Barnes are co-creators of Effective Enterprise AI and Applied End-to-End Flow, and co-authors of the Applied End-to-End Flow book series. Their work combines enterprise diagnosis, value-delivery mechanics, and practical intervention patterns across strategy, portfolios, value streams, and teams.