Focusing Visual Reference
Companion reference for the Applied End-to-End Flow series.
Use this appendix with the Value Acceleration Process. The executive, value-stream, and team visuals support Visual Discovery. The generic Effort by Impact matrix is the last resort, used only when no pre-built visual fits and the group cannot construct a domain-specific view of its actual problem space.
B.1 Purpose
These visuals help a Value Acceleration Process (VAP) group examine the system around its agreed outcome. Use the zones and components to surface both obstacles and opportunities that participants might otherwise overlook.
During discovery, participants place obstacles and opportunities near the components they affect. The visual helps prevent brainstorming from drifting toward whoever speaks loudest or whatever crisis is freshest. It prompts systematic coverage of the governance and delivery system.
The executive-level visual covers strategic planning, portfolio governance, value realization, and feedback. Use it when diagnosing friction in how the organization makes decisions, allocates resources, and learns from results. The value-stream-level visual covers the full delivery flow from strategic intake through release management. Use it when diagnosing friction in how work moves from concept to customer. The team-level visual covers what arrives, how the team works, where it depends on others, and what feedback returns. Use it when diagnosing friction around one delivery team’s work and interfaces.
When none of the three pre-built discovery visuals fits, create or adapt a domain-specific view of the system around the outcome. A value stream map, customer journey, process diagram, dependency map, or incident timeline can give Visual Discovery the structure it needs. When the group cannot construct one, the generic Effort by Impact matrix in section B.6 is the fallback.
B.2 The Executive-Level Visual
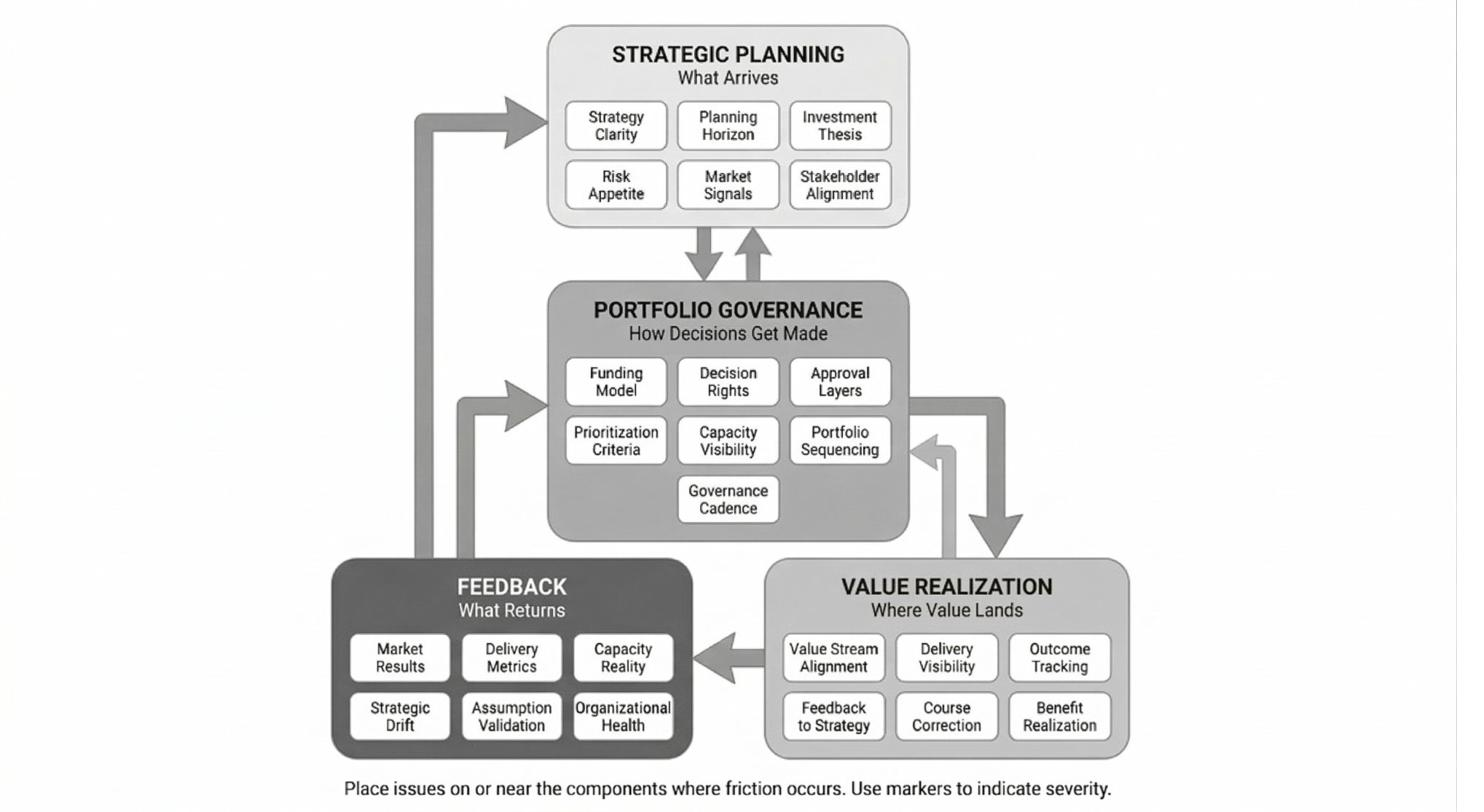
The executive-level visual has four zones:
Strategic Planning: What Arrives. This zone covers the inputs that shape organizational direction. Strategy Clarity, Planning Horizon, Investment Thesis, Risk Appetite, Market Signals, and Stakeholder Alignment. Friction here manifests as Alignment Drift: decisions made without clear direction, competing interpretations of priority, or disconnection between market reality and organizational response.
Portfolio Governance: How Decisions Flow. This zone covers how the organization allocates resources and makes commitments. Funding Model, Decision Rights, Approval Layers, Prioritization Criteria, Capacity Visibility, Portfolio Sequencing, and Governance Cadence. Friction here manifests as Choked Flow at the enterprise level: work waiting for decisions, resources locked in low-value initiatives, or governance processes that add delay without adding value.
Value Realization: Where Value Lands. This zone covers how strategic intent translates into delivered outcomes. Value Stream Alignment, Delivery Visibility, Outcome Tracking, Feedback to Strategy, Course Correction, and Benefit Realization. Friction here shows up as a disconnect between what was planned and what was delivered, or between what was delivered and what was measured.
Feedback: What Returns. This zone covers the signals that should inform future decisions. Market Results, Delivery Metrics, Capacity Reality, Strategic Drift, Assumption Validation, and Organizational Health. Friction here manifests as Broken Feedback at the enterprise level: decisions made without data, assumptions that persist despite contrary evidence, or organizational stress that leadership cannot see.
B.3 Executive Visual Component Reference
The following sections detail each component of the executive-level visual, with example friction patterns to prompt discovery.
Strategic Planning Zone
Strategy Clarity
Friction shows up when:
-
Different executives articulate different strategic priorities
-
Teams interpret the same strategic goal in incompatible ways
-
“Strategic alignment” means different things in different meetings
-
Quarterly priorities change without clear rationale
-
The strategy document exists but nobody references it in decisions
Planning Horizon
Friction shows up when:
-
Annual planning assumes certainty that does not exist
-
Long-term commitments block adaptation to market changes
-
Planning cycles consume months of leadership attention
-
Plans become outdated before execution begins
-
Rolling forecasts exist but do not influence commitments
Investment Thesis
Friction shows up when:
-
Major investments lack articulated hypotheses about value creation
-
Success criteria are defined retroactively to match results
-
Portfolio reviews evaluate activity rather than outcomes
-
“Strategic” initiatives receive funding without business case scrutiny
-
Investment decisions optimize for political safety over value
Risk Appetite
Friction shows up when:
-
Risk tolerance varies by who is in the room
-
Innovation initiatives die in risk review while competitors advance
-
Risk frameworks designed for operations are applied to experiments
-
Fear of failure prevents validated learning
-
Risk mitigation becomes risk avoidance
Market Signals
Friction shows up when:
-
Customer feedback reaches leadership filtered and delayed
-
Competitive intelligence is anecdotal rather than systematic
-
Market changes surprise leadership despite available data
-
Sales and product have different views of customer needs
-
External signals cannot penetrate internal assumptions
Stakeholder Alignment
Friction shows up when:
-
Board expectations conflict with executive team priorities
-
Major initiatives lack sponsor clarity
-
Cross-functional initiatives have multiple competing owners
-
Stakeholder agreements unravel when implementation begins
-
Political dynamics override strategic logic
Portfolio Governance Zone
Funding Model
Friction shows up when:
-
Annual budgets lock resources regardless of value delivered
-
Funding decisions happen once per year despite continuous learning
-
Project accounting prevents resource fluidity
-
Cost center optimization defeats enterprise value creation
-
CapEx/OpEx distinctions distort technology decisions
Decision Rights
Friction shows up when:
-
Nobody knows who can say yes
-
Decisions require consensus that never forms
-
Escalation is the default path for routine choices
-
Delegated authority exists on paper but not in practice
-
Decisions made are revisited without new information
Approval Layers
Friction shows up when:
-
Approval chains add weeks without adding insight
-
The same decision requires multiple committee reviews
-
Approvers lack context to evaluate what they are approving
-
Approval denial comes without actionable feedback
-
Expedited paths exist but require executive intervention
Prioritization Criteria
Friction shows up when:
-
Priority is determined by volume rather than value
-
Everything is Priority 1
-
Prioritization criteria exist but are not applied
-
Urgent displaces important without examination
-
Deprioritization never happens, only addition
Capacity Visibility
Friction shows up when:
-
Portfolio decisions assume capacity that does not exist
-
Commitments exceed capacity by multiples, not margins
-
Utilization metrics hide the capacity consumed by coordination
-
Shared resources are oversubscribed across competing demands
-
“Full capacity” means something different to finance and delivery
Portfolio Sequencing
Friction shows up when:
-
Everything must start now regardless of dependencies
-
Sequencing decisions are not made, resulting in everything in flight
-
Dependencies are discovered after commitments are made
-
The portfolio has no concept of “not yet”
-
Work in progress exceeds capacity to complete
Governance Cadence
Friction shows up when:
-
Portfolio reviews happen quarterly regardless of need
-
Steering committees meet but do not steer
-
Decisions wait for the next scheduled meeting
-
Governance ceremonies consume time without producing decisions
-
The cadence fits the calendar, not the work
Value Realization Zone
Value Stream Alignment
Friction shows up when:
-
Teams are organized around functions, not value delivery
-
Value streams exist on paper but not in practice
-
Work crosses organizational boundaries multiple times before delivery
-
Nobody owns the end-to-end flow
-
Value stream mapping is a one-time exercise, not continuous practice
Delivery Visibility
Friction shows up when:
-
Leadership learns about delivery problems from customers
-
Status reports are optimistic until crisis forces honesty
-
Metrics measure activity rather than outcomes
-
Different stakeholders see different versions of reality
-
Visibility requires heroic effort rather than system design
Outcome Tracking
Friction shows up when:
-
Projects are declared complete when features ship, not when outcomes materialize
-
Benefits realization is someone else’s problem
-
Success metrics are defined but never measured
-
Outcome data exists but does not reach decision-makers
-
Nobody asks “did it work?” after launch
Feedback to Strategy
Friction shows up when:
-
Delivery learnings do not influence strategic assumptions
-
Strategy persists despite contradictory evidence
-
The feedback loop from execution to planning takes quarters
-
Course correction requires crisis rather than data
-
Strategic reviews focus on plans, not results
Course Correction
Friction shows up when:
-
Pivoting is seen as failure rather than learning
-
Sunk cost fallacy drives continued investment in failing initiatives
-
Course correction requires re-litigating original decisions
-
Small adjustments require the same approval as major changes
-
The organization is better at starting than stopping
Benefit Realization
Friction shows up when:
-
Business cases are never revisited after approval
-
Projected benefits are not tracked against actuals
-
Nobody is accountable for realizing promised value
-
Benefits are assumed from completion rather than measured from use
-
The gap between projected and actual ROI is invisible
Feedback Zone
Market Results
Friction shows up when:
-
Revenue and growth data do not connect to specific initiatives
-
Win/loss analysis stays in sales, not strategy
-
Market share changes surprise leadership
-
Customer retention signals arrive too late to act
-
Competitive moves are discovered after impact
Delivery Metrics
Friction shows up when:
-
Velocity and throughput data do not reach portfolio decisions
-
Quality metrics are collected but not analyzed for trends
-
Predictability data exists but does not influence commitments
-
Metrics are gamed to hit targets rather than improve performance
-
The metrics that matter are not the metrics that are measured
Capacity Reality
Friction shows up when:
-
Planned capacity and actual capacity differ by multiples
-
Unplanned work consumes capacity without visibility
-
Technical debt drag is not quantified
-
Turnover impact on capacity is underestimated
-
Capacity planning uses fiction rather than historical data
Strategic Drift
Friction shows up when:
-
Execution diverges from strategy without detection
-
Operational urgency crowds out strategic priorities
-
The portfolio drifts toward short-term wins
-
Strategic initiatives starve while maintenance grows
-
Nobody asks whether current work advances stated strategy
Assumption Validation
Friction shows up when:
-
Strategic assumptions are never tested
-
Business cases contain assumptions treated as facts
-
Experiments are not designed to validate assumptions
-
Disconfirming evidence is explained away
-
The organization learns slowly despite abundant data
Organizational Health
Friction shows up when:
-
Engagement data does not reach decision-makers
-
Turnover patterns do not influence capacity planning
-
Burnout is invisible until attrition spikes
-
Organizational stress shows up in delivery but is attributed to other causes
-
Health indicators are collected but not acted upon
B.4 The Value-Stream-Level Visual
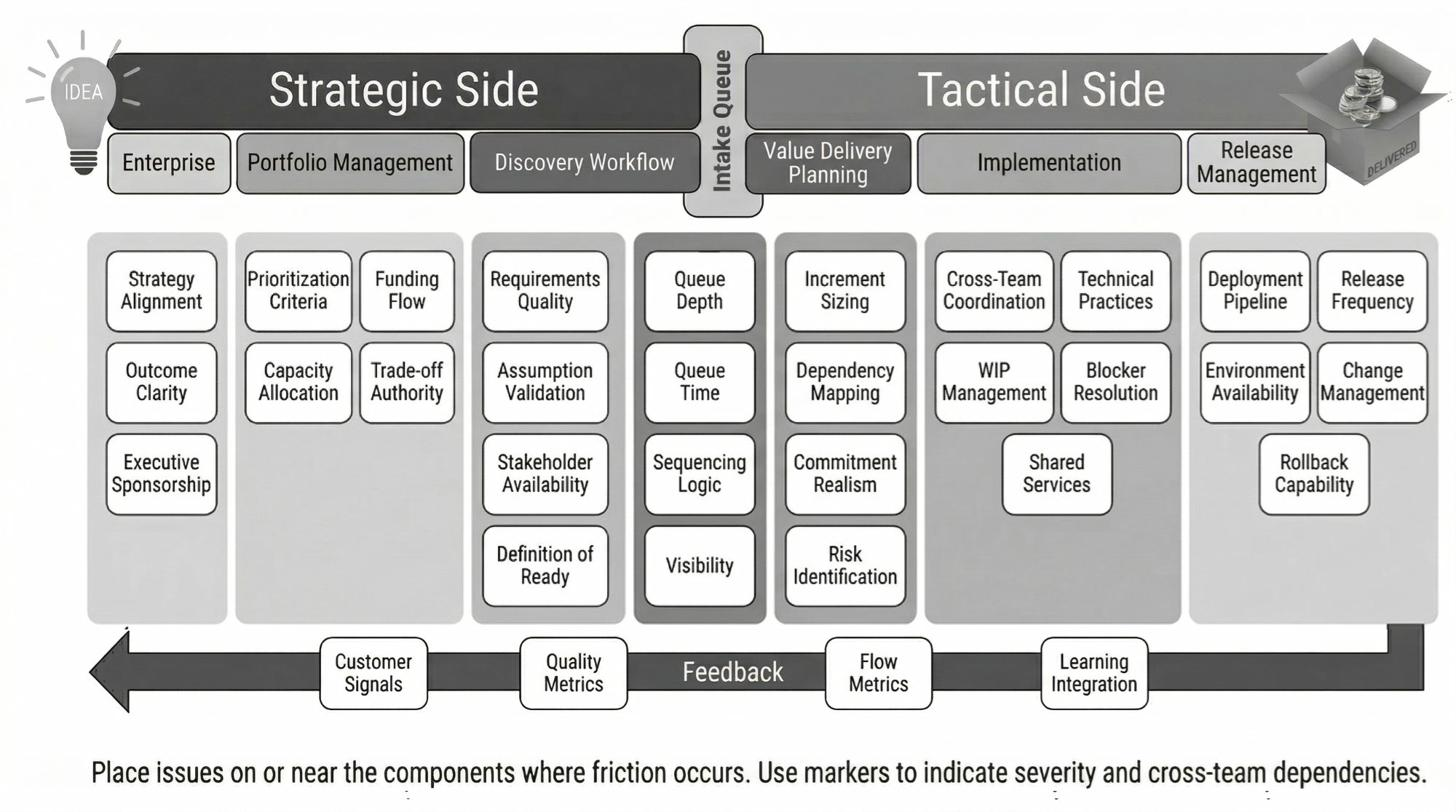
The value-stream-level visual spans the full delivery flow, divided into Strategic Side and Tactical Side with an Intake Queue bridging them.
Strategic Side. This side covers how work enters the value stream: Enterprise context (strategy clarity, market signals, stakeholder expectations), Portfolio Management (funding, prioritization, capacity allocation), and Discovery Workflow (requirements elaboration, technical feasibility, estimation). Friction here shows up as work arriving unclear, unstable, or misaligned with strategic intent.
Intake Queue. The bridge between strategic and tactical. Work waits here after discovery, before implementation begins. Queue depth, aging, and churn reveal friction in the handoff from planning to execution.
Tactical Side. This side covers how work flows through delivery: Value Delivery Planning (iteration planning, commitment, dependency coordination), Implementation (development, testing, integration, quality practices), and Release Management (deployment pipeline, release coordination, production readiness). Friction here shows up as work stalling, queueing, or never quite finishing.
Value stream managers use this visual to diagnose constraints across the entire flow, not just within their direct span of control. Chapter 8 describes how to facilitate discovery using this visual.
B.5 The Team-Level Visual
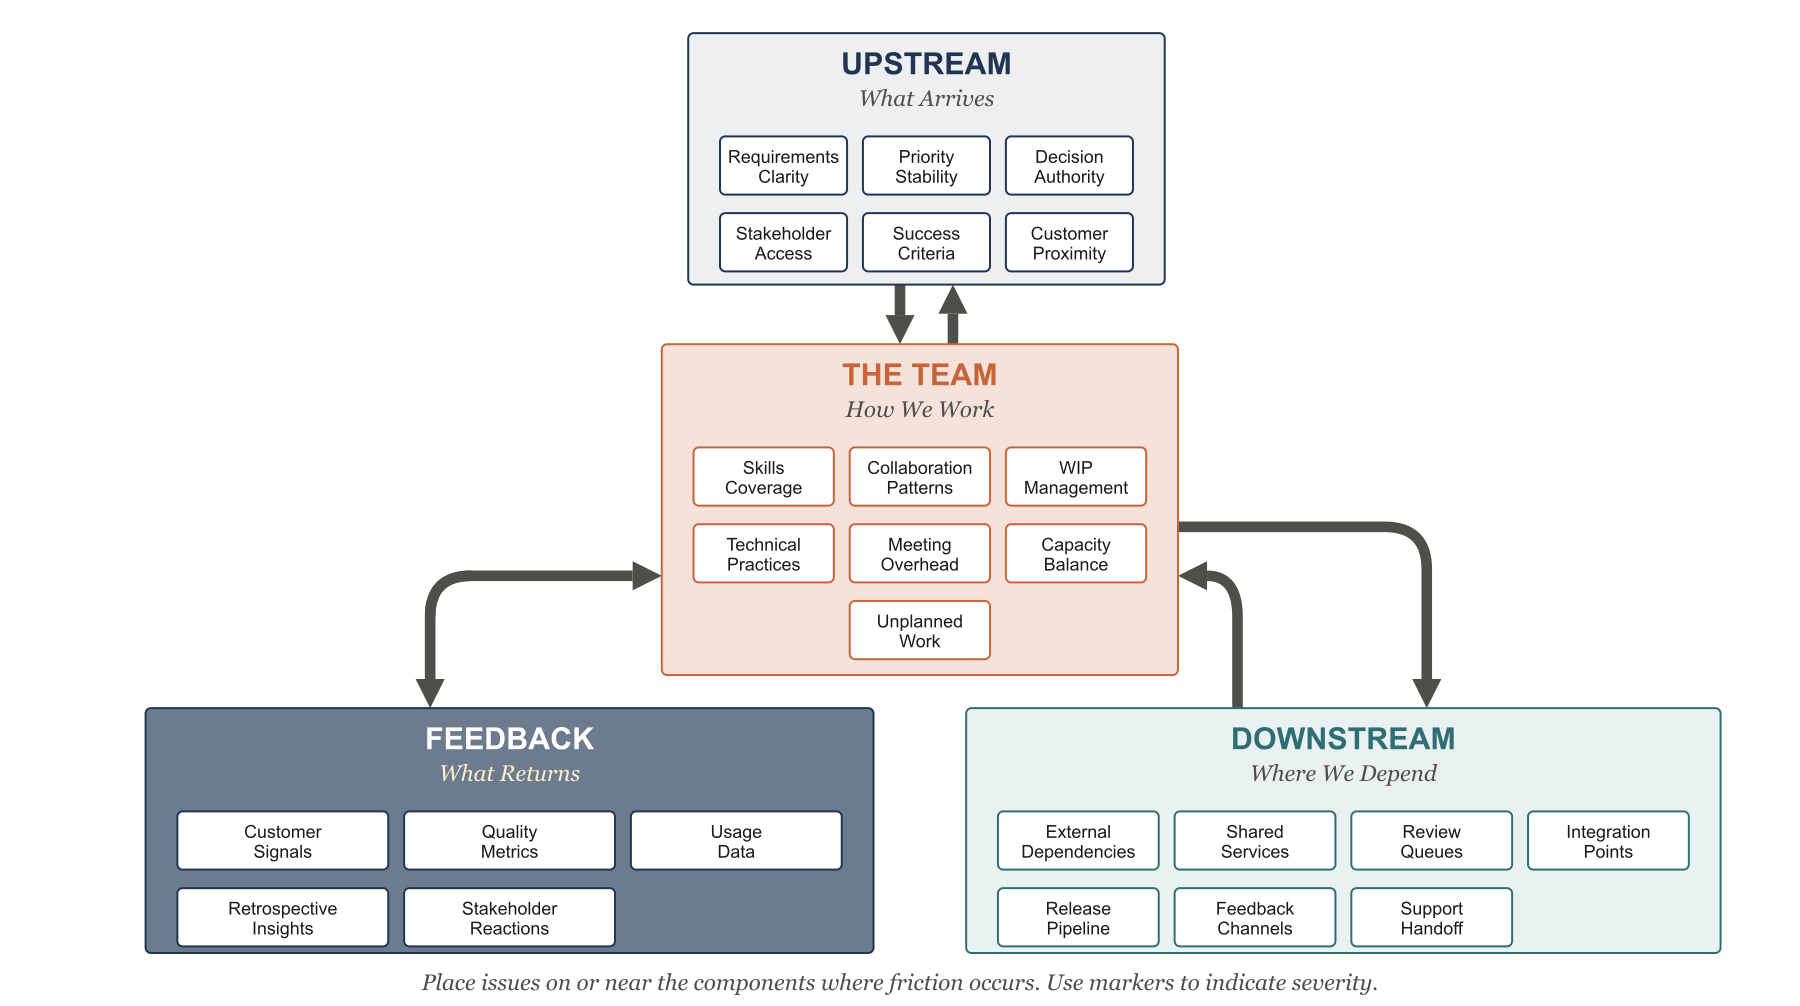
The team-level visual has four zones:
Upstream: What Arrives. This zone covers what reaches the team before work begins: requirements clarity, priority stability, decision authority, stakeholder access, success criteria, and customer proximity. Friction here often appears as unclear, unstable, or disconnected work.
The Team: How We Work. This zone covers the team’s internal patterns: skills coverage, collaboration, work in progress, technical practices, meeting overhead, capacity balance, and unplanned work. Friction here often appears as overloaded flow, fragile ownership, or coordination cost inside the team.
Downstream: Where We Depend. This zone covers what the team needs from others to deliver: external dependencies, shared services, review queues, integration points, release pipelines, feedback channels, and support handoffs. Friction here often appears as waiting and constraints outside the team’s direct control.
Feedback: What Returns. This zone covers the signals that should inform the team’s next decisions: customer signals, quality metrics, usage data, retrospective insights, and stakeholder reactions. Friction here often appears as late, filtered, or missing evidence.
Use this visual when the outcome concerns one team’s delivery system and its interfaces. Place observations near the component where an obstacle or opportunity affects the outcome, then filter them against the measurable outcome before admitting them to the initial improvement backlog.
The Team Focusing Visual Reference explains all 25 components with diagnostic questions and example friction patterns.
B.6 The Generic Effort by Impact Visual
The generic Effort by Impact matrix organizes items without showing the particular system around the outcome. It therefore supplies fewer domain-specific prompts. It remains the fallback when the two conditions below hold.
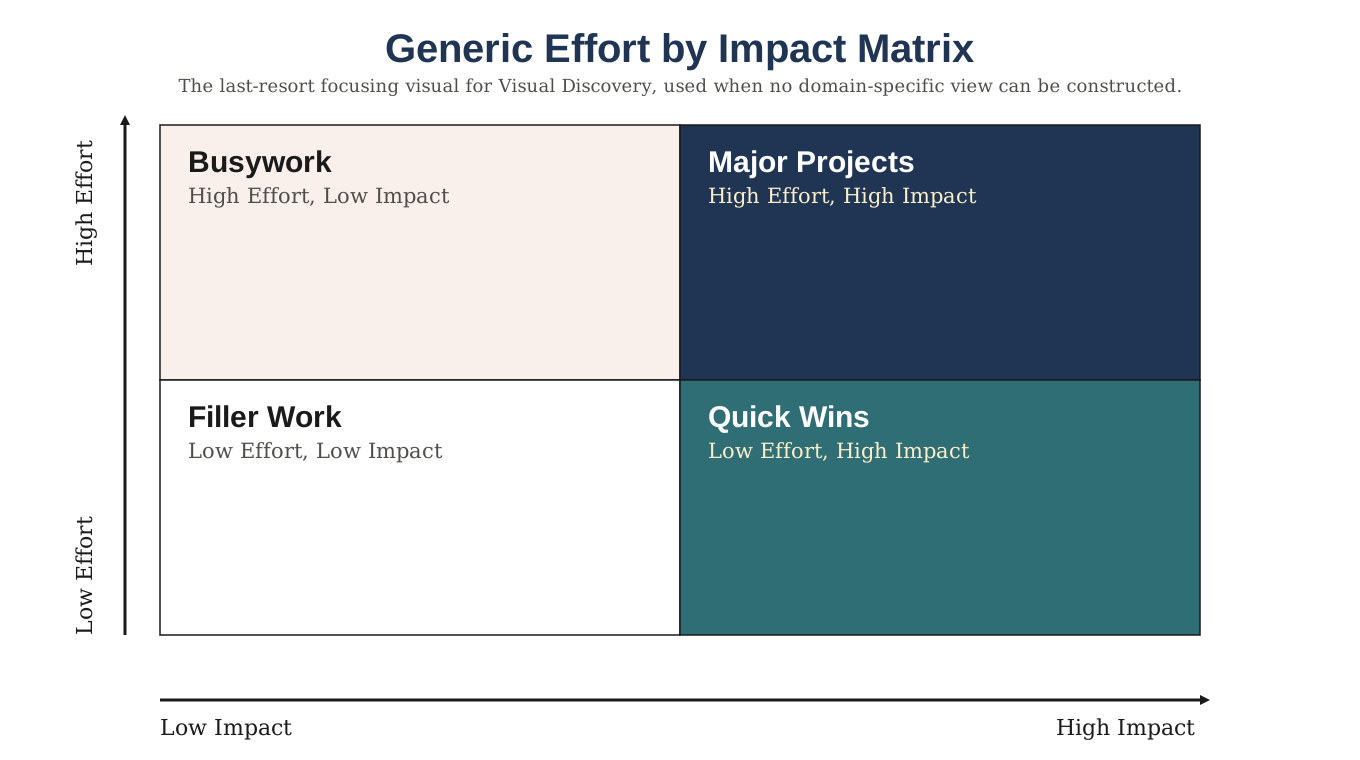
The matrix organizes discovery items into four quadrants by relative effort and expected impact on the outcome: Quick Wins (high impact, low effort), Major Projects (high impact, high effort), Filler Work (low impact, low effort), and Busywork (low impact, high effort). Participants place obstacles and opportunities on it, filter them against the measurable outcome, and admit what passes to the initial improvement backlog, exactly as they would with any other focusing visual.
When to Use the Generic Visual
Use the matrix only when both conditions hold:
-
None of the pre-built visuals fits the problem space
-
The group cannot construct or adapt a domain-specific view of the actual system
Constructing that view is always worth attempting first: it anchors the conversation in the actual system, and anchored conversations produce better discovery.
B.7 Using the Visuals in Practice
Before the Session
-
Complete Measurable Outcomes. What result are you trying to improve?
-
Select or create the appropriate visual based on problem scope
-
Share the outcome with participants in advance
-
Print or project the focusing visual
-
Review the friction examples to prime your own observations
During Discovery
-
Place obstacles or opportunities near the component they concern
-
Use the zone headers to prompt coverage
-
Use the friction examples as prompts: “Anything like this happening for us?”
During Discovery: Clustering and Filtering
-
Group related issues
-
Do not force clustering. If issues seem related but distinct, keep them separate
-
Filter against the outcome: “Does this connect to what we are trying to improve?”
-
Items that do not pass the filter are out of scope, not unimportant
Closing Discovery
-
Admit the filtered items to the initial improvement backlog with enough specificity to act
-
Name the execution owner, schedule stakeholder review dates, and name the initial stakeholders who will review progress with the owner as the steering group before the group breaks up
-
The backlog leaves the event nominally unsequenced: participants may suggest an order, but that suggestion is advice for the execution owner, who sets the operative order
-
Photograph or save the visual with issues placed. It is a record of what you found
-
After the event, follow the VAP execution and review procedure
B.8 Customizing the Visuals
The focusing visuals are starting points. Your organization may benefit from customization:
-
Add components specific to your context (specific governance bodies, specific upstream dependencies, specific regulatory requirements)
-
Remove components that do not apply
-
Rename components to match your vocabulary
-
Add zones if your context requires them
The visual’s purpose is to prompt comprehensive coverage of your problem space. Customize it to serve that purpose in your context. Share customizations across your leadership team so everyone works from the same frame.