Focusing Visual Reference
Companion reference for Applied End-to-End Flow: Team.
By Curtis Hibbs and Joshua Barnes
“We keep getting blocked” names a frustration. It does not yet show where work waits, what it needs, or how that wait affects the result the team wants to improve. A focusing visual gives participants a shared picture on which to place those observations and connect them.
Use this reference with Chapter 8 of Applied End-to-End Flow: Team. It explains the team canvas, gives friction examples for every component, and includes two resources for situations the standard canvas does not fit. Focusing visuals are aids to Visual Discovery, the collaborative event in the Value Acceleration Process (VAP). Agree the outcome and identify the participants before that event. Include people who experience the parts of the system being examined. Use the visual to examine what blocks the outcome and what could help achieve it.
Choose a Visual That Fits the Problem
Use the team canvas when the outcome concerns one team’s delivery and its interfaces: what arrives, how the team works, where it depends on others, and what feedback returns.
For an outcome spanning a value stream or enterprise governance, examine the value-stream and executive canvases instead. Choose by the scope of the problem, not the seniority of the person convening the session.
When none of those canvases fits, construct or adapt a view of the actual problem space. The construction aid below is one way to start. Use the generic Effort by Impact visual only when no pre-built visual fits and the group cannot construct a domain-specific view.
The Team Canvas
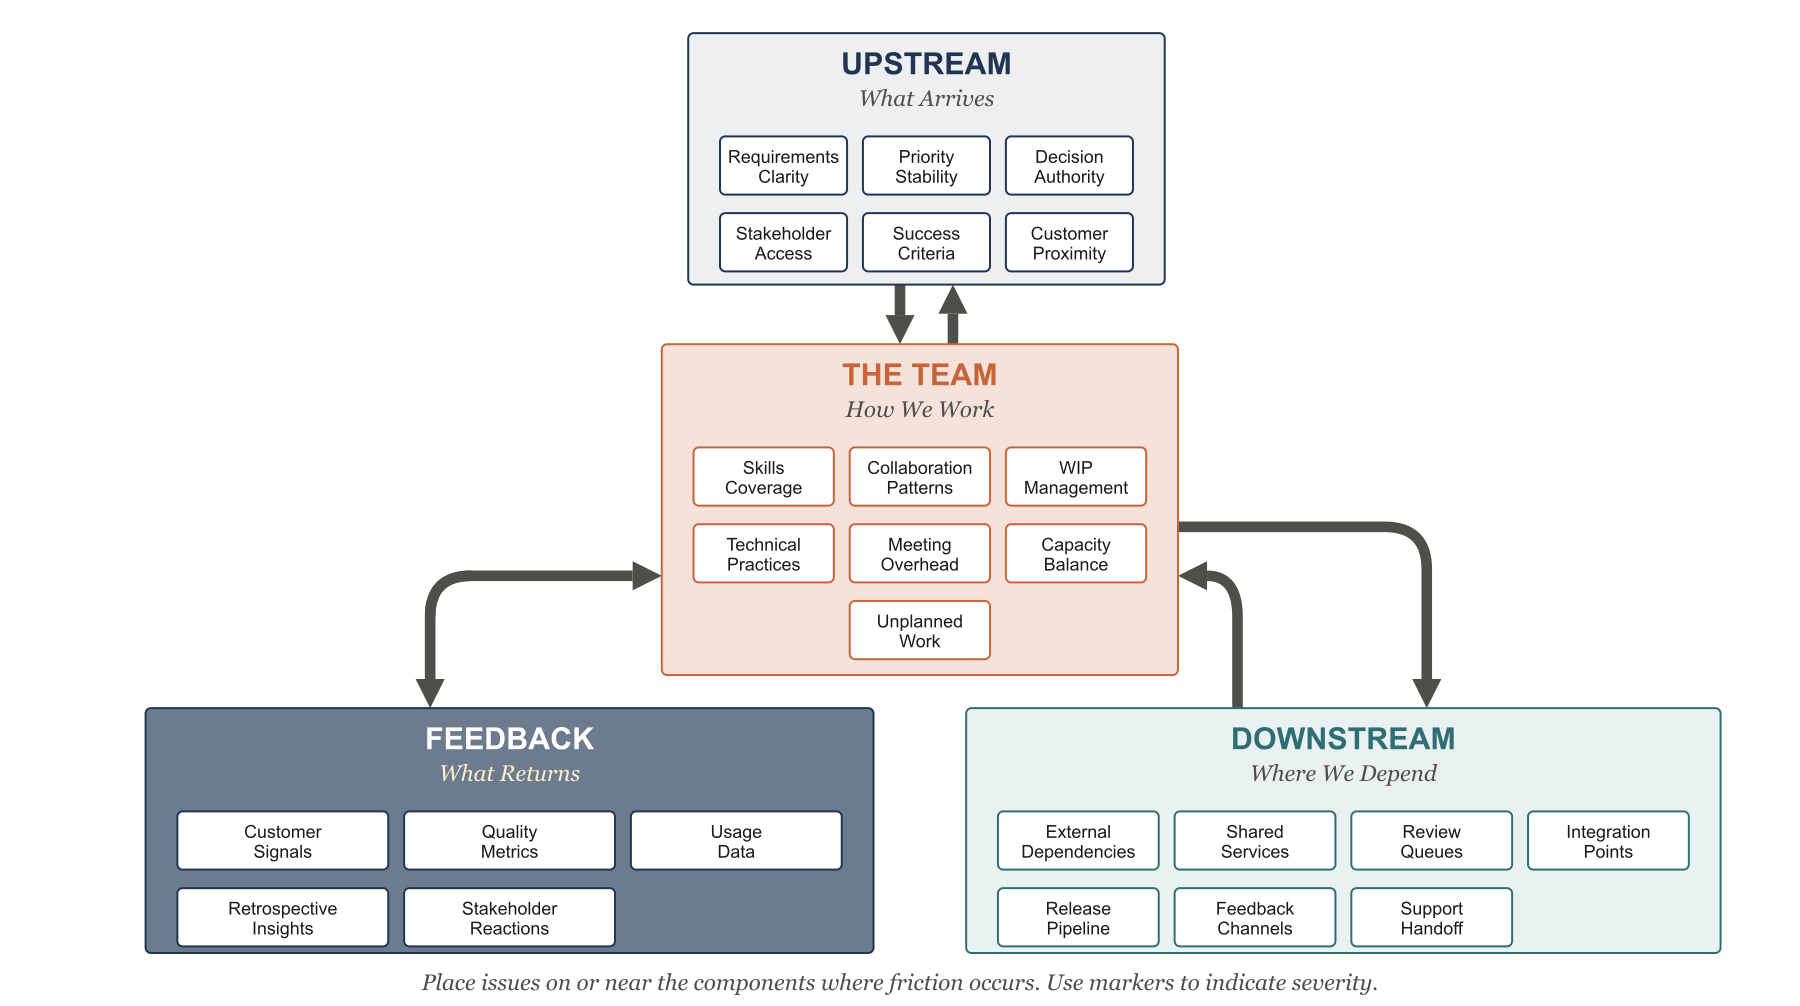
The four zones prompt different questions:
- Upstream: What Arrives. What shapes the work before the team starts it?
- The Team: How We Work. What happens inside the team as work moves toward completion?
- Downstream: Where We Depend. What does the team need from others to get work delivered and supported?
- Feedback: What Returns. What evidence comes back, and can the team use it to learn?
The arrows show connections between zones. Place an observation near the components it concerns, and name the connection when it crosses components. If you use the graphic’s suggested severity markers, agree what the marks mean and record the observed effect alongside them. The canvas supplies no severity scale.
The zones help you look across the delivery system. They do not establish who has authority to change it. A dependency may need joint action; an internal practice may still be governed by an external policy. Use the Implementation Guidelines and the book’s constraint diagnosis to identify the obstruction limiting delivery and who can change it.
Component Reference
Each entry explains what to examine and gives two example friction patterns. These are prompts for recognition, not findings about your team or a checklist to score. Bring specific observations and connect them to the agreed outcome. An empty area of the canvas may mean there is no relevant issue there, or that a perspective is missing. Check with people who know that part of the system before treating an empty area as evidence that nothing needs attention.
Upstream: What Arrives
Requirements Clarity
Can the team tell what is needed well enough to carry out the work? Examine missing details and incompatible interpretations.
- Work begins with an unanswered question, then returns for rework when the answer arrives.
- Two people implement different interpretations of the same request.
Priority Stability
Can the team understand and respond to changes in what matters most? Examine how changed priorities affect work already underway.
- A new urgent request displaces active work without anyone deciding what should stop.
- Priorities change, but commitments to the displaced work remain in place.
Decision Authority
Is it clear who can make a decision the work needs, and can that person exercise the authority?
- A question passes between people who can advise but cannot decide.
- A delegated decision is repeatedly reopened by someone outside the agreed decision path.
Stakeholder Access
Can the team reach the people who can clarify intent, settle a question or evaluate the result?
- Questions wait until a stakeholder’s next available meeting while the affected work stays open.
- Answers arrive through intermediaries who cannot explain the reasons or resolve follow-up questions.
Success Criteria
Does the team know how the result will be judged? Examine whether expectations are shared before work starts.
- Acceptance depends on an expectation first revealed at the final review.
- Different stakeholders judge the same result against incompatible criteria.
Customer Proximity
How directly can the team understand the people who will use or receive its work?
- A request specifies a solution, but nobody available can explain the user problem behind it.
- Customer observations pass through several handoffs and reach the team stripped of context.
The Team: How We Work
Skills Coverage
Can the team complete the work it accepts without repeatedly waiting for scarce knowledge or capability?
- One person’s absence stops a recurring class of work.
- Several items reach the same specialist at once while other team members cannot help finish them.
Collaboration Patterns
How do people coordinate work that needs more than one person’s contribution?
- Individual pieces appear complete, but their differences emerge only when they are combined.
- A handoff loses the reasoning behind a choice, forcing the recipient to reconstruct it.
WIP Management
Work in progress (WIP) is work started but not finished. Examine how starting decisions affect the team’s ability to complete what it carries.
- People start new items while older items wait for attention from the same people.
- Blocked work disappears from discussion even though it remains unfinished.
Technical Practices
Do the methods and tools used to produce and verify the work support reliable completion? In non-software work, examine the equivalent production and quality practices.
- A manual check is repeatedly skipped under pressure, and the same defect returns.
- Problems emerge late because verification happens only after the work is assembled.
Meeting Overhead
What do meetings enable, and what capacity do they consume? Examine whether the time produces decisions or coordination the work needs.
- Several meetings ask for the same status without resolving the blocker being reported.
- Fragmented calendars leave too little shared time to complete work together.
Capacity Balance
Does the team’s mix of commitments fit the time and capabilities actually available?
- Plans assume full delivery capacity while the same people also cover support and review work.
- One type of work queues behind an overloaded role while capacity elsewhere cannot relieve it.
Unplanned Work
What enters outside the plan, and how does it change the work the team can finish?
- Informal requests consume time but never appear in the shared view of work.
- Recurring interruptions are treated as surprises, so planned commitments repeatedly exceed available capacity.
Downstream: Where We Depend
External Dependencies
What must another team, supplier or decision-maker provide before the work can progress?
- A dependency becomes visible only after the team has committed to a delivery date.
- Work waits on another group’s contribution without a shared understanding of when it is needed.
Shared Services
How does access to a shared capability affect delivery? Examine demand, availability and the path for obtaining help.
- Requests queue behind other teams’ demand with no visibility into likely availability.
- Teams submit requests repeatedly because the service’s intake requirements are unclear.
Review Queues
Where does work wait for evaluation, and what must be present for that review to be useful?
- Finished work waits for a review slot even though the review itself is brief.
- Reviewers return work for missing evidence that the team did not know it needed to provide.
Integration Points
Where must this team’s output connect with another system or another group’s work?
- Interface assumptions differ and are discovered only when completed pieces meet.
- Separate changes work locally but conflict when combined.
Release Pipeline
What must happen between a completed item and its availability to the people who need it?
- Completed work accumulates while it waits for a release window or a release decision.
- A manual release handoff repeatedly introduces errors or requires the same explanation to be rebuilt.
Feedback Channels
Is there a working route by which information about delivered work can reach the team?
- Support records a recurring problem, but there is no route from that record to the delivery team.
- Feedback reaches a shared inbox without anyone responsible for bringing it into a decision.
This component examines the route. The Feedback zone below examines the signals carried by it and whether they inform the team’s work.
Support Handoff
Can the people supporting the delivered result understand and operate it after the team hands it over?
- Support inherits a change without the information needed to recognize or handle known failure conditions.
- Questions bounce between delivery and support because ongoing responsibility is unclear.
Feedback: What Returns
These components examine the returning signals and what the team learns from them. For the route that carries those signals, see Feedback Channels.
Customer Signals
What do customers’ experiences tell the team about the problem its work was meant to address?
- A complaint reaches the team without enough context to understand what the customer was trying to do.
- The same customer difficulty returns after delivery, but nobody connects it to the expected improvement.
Quality Metrics
What does the evidence reveal about defects, failures and rework? Examine what the measures expose and what they leave out.
- Reports count defects found inside the team while failures experienced after delivery remain separate and unseen.
- Rework is recorded as new work, hiding repeated correction of the same problem.
Usage Data
Can the team see whether and how people use what it delivers?
- A release is declared successful without checking whether its intended users use it.
- Aggregate activity looks healthy but hides the point where users abandon the task the change was meant to help.
Retrospective Insights
Does the team’s reflection produce learning that changes subsequent work?
- The same problem returns at each retrospective without a record of what was tried or learned.
- An improvement is implemented, but its effect is never examined before the team chooses another action.
Stakeholder Reactions
What do stakeholder responses reveal about expectations, trade-offs and results?
- Approval at a demonstration is treated as evidence of benefit before anyone examines actual use.
- Concerns surface through a late escalation even though earlier reviews appeared supportive.
Turn a Prompt into a Useful Observation
Use the examples to ask whether something similar occurs in your system. Then replace the general pattern with what participants have actually seen. Notes belong near the components they concern; their position gives the conversation a starting point, not a final diagnosis.
For example, suppose the agreed outcome is to reduce rework caused by unresolved intent. “Stakeholders are unavailable” is too broad to explain what happens. An illustrative note would be: “Work starts while an acceptance question is unanswered; when the answer arrives, the team changes work already completed.” It connects Stakeholder Access to Requirements Clarity and gives participants something they can confirm, challenge or explain.
Look for opportunities as well as obstacles. In the same example, participants might observe that direct access to a knowledgeable stakeholder on one kind of request resolves questions before work starts. Extending that access is a possibility to examine, not proof that it will solve every case.
Participants compare observations, connect related items and test their relevance to the agreed outcome. Outcome-relevant obstacles and opportunities enter the improvement backlog. Recording an observation does not supply authority to change another group’s work.
Use the complete VAP procedure to run and close discovery and to organize execution and review afterward. The canvas helps create the backlog; it does not replace that follow-through.
Constructing a Visual for Your Problem
If the pre-built canvases do not represent the problem, use a view that does. An existing process diagram, dependency map, customer journey or incident timeline may already show the relevant system.
The construction aid below offers another starting point. Prepare the visual before using it for discovery, with people who know the parts of the system it will show. Fill its spaces with the actual systems, teams, queues and handoffs you need to examine:
- Sources: where work, demand or information comes from.
- The Work: where the effort happens.
- Destinations: who or what depends on what is produced.
- Feedback: what signals return from destinations to the start, and when.
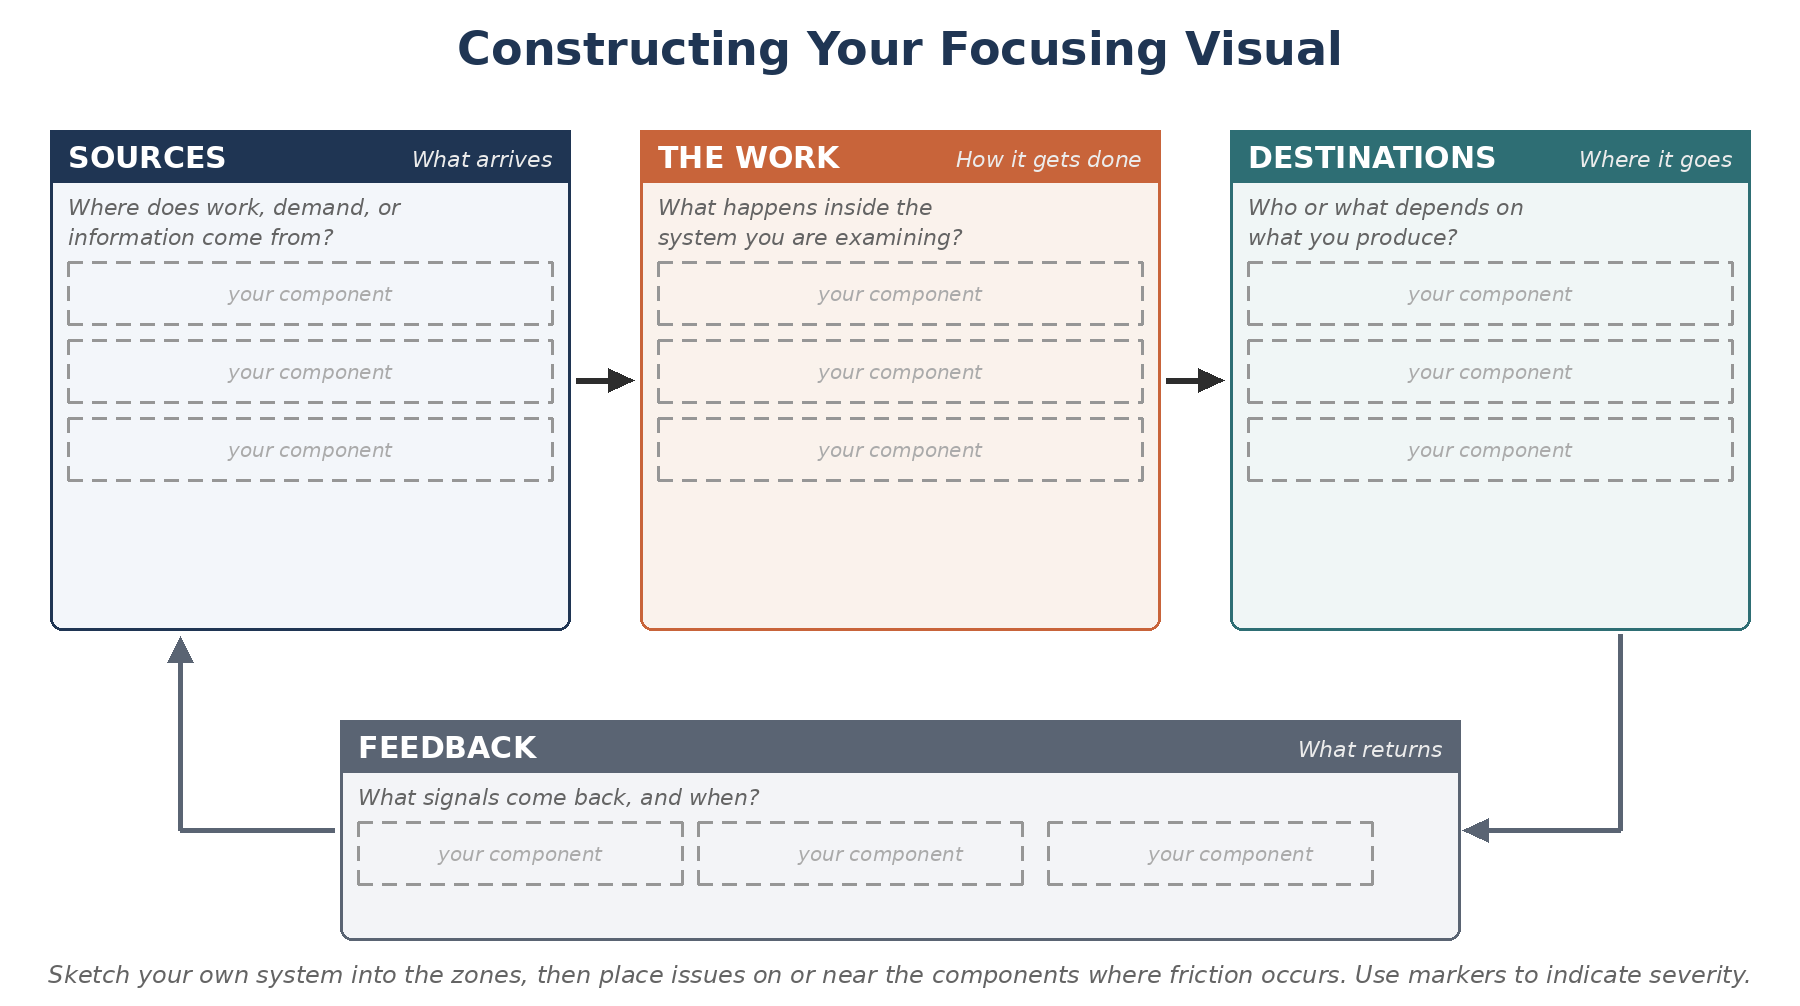
For a support-request process, for example, Sources might contain the request channels; The Work, triage and specialist investigation; Destinations, the people waiting for an answer; and Feedback, reopened requests and their reasons. These are illustrative labels. Use the components and relationships that represent your problem, and adapt the shape if another arrangement makes them clearer.
The finished visual becomes the canvas for discovery. A blank scaffold alone cannot prompt participants about the specific queues, interfaces or decisions they need to examine.
The Generic Effort by Impact Visual
The Effort by Impact matrix is a fallback for discovery. Use it only when no pre-built visual fits and the group cannot construct a domain-specific view. It helps participants compare their expectations about effort and impact; it does not show the actual delivery system or provide the Team canvas’s component prompts.
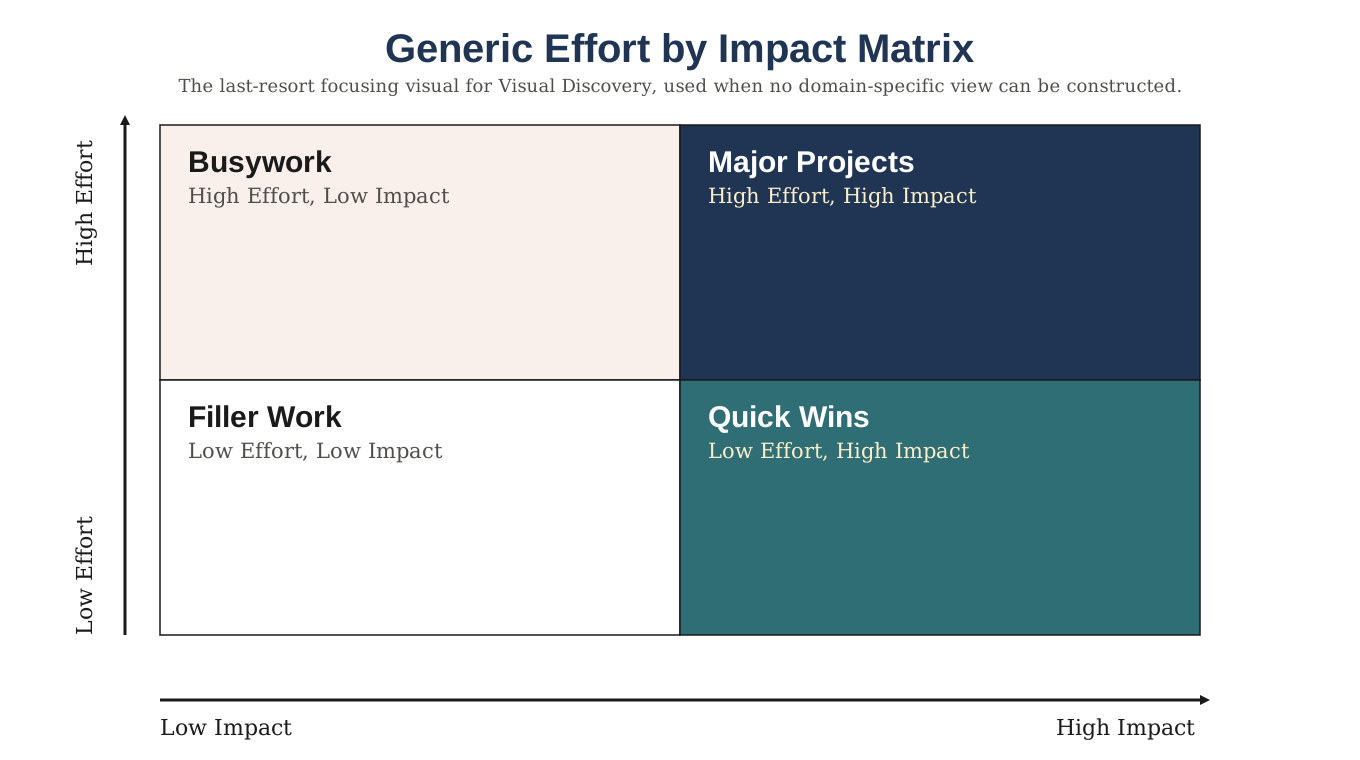
Participants place obstacles and opportunities on the matrix and examine their connection to the outcome. For example, clarifying a recurring intake question and rebuilding a shared delivery tool may involve different effort and expected impact. Those are judgments to discuss using what participants know, not measured results supplied by the diagram.
The labels do not prescribe an execution sequence. “Quick Wins” does not mean “always do these first,” and an item that needs substantial effort is not excluded merely by its quadrant. Outcome relevance determines what belongs on the backlog. Participants may suggest an order during discovery. Afterward, the execution owner decides the order in which work will actually be done, using that advice as input. VAP prescribes no particular prioritization technique.
Related Resources
- Implementation Guidelines helps choose and carry through a first improvement that fits the team’s constraint, authority and capacity.
- The Value Acceleration Process explains preparation, discovery, execution and review.
- The series Focusing Visual Reference provides the executive and value-stream canvases for wider problem scopes.
- Applied End-to-End Flow: Team supplies the diagnosis and Chapter 8 treatment behind this companion.
Curtis Hibbs and Joshua Barnes are co-creators of Effective Enterprise AI and Applied End-to-End Flow, and co-authors of Applied End-to-End Flow: Enterprise. Their work combines enterprise diagnosis, value-delivery mechanics, and practical intervention patterns across strategy, portfolios, value streams, and teams.